Enrichment Analysis
The Cell Blueprint enables users to go beyond simple interaction analysis with additional enrichment analysis tools.
Users can perform various types of enrichment analysis such as Gene Ontology (GO) enrichment analysis for selected nodes, disease, drugs and pathways analysis in order to gain insights into biological functional significance of the nodes selected. To perform enrichment analysis for a nodeset simply click on the enrichment icon on the nodebox when available. GO enrichment analysis is launched automatically. Users can hover their cursor over the stacked bars to reveal the most significant GO hits.
Users can select “See More Details” to access detailed metrics and annotations for each GO term, facilitating comprehensive interpretation of analysis results.
Using the drop down menu, users can change the type of enrichment to disease, drug or pathway and automatically retrieve enrichment results.
Lastly, users can download the full enrichment table by clicking on the “Download Enrichments” button, enabling users to save and further explore their enrichment results.
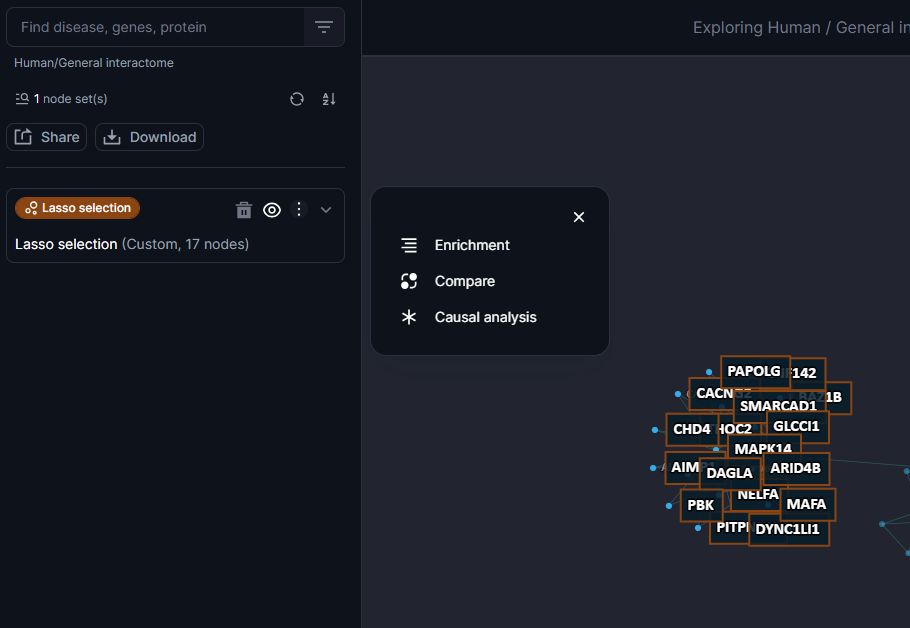
Figure 25. The enrichment tool available at the nodeset level
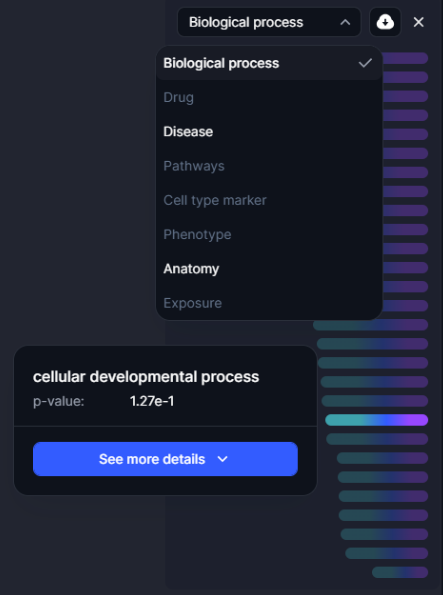
Figure 26. The enrichment results
Network analysis tool
The network analysis tool enables users to evaluate the proximity between two nodesets on the Cell Blueprint. It calculates the average distance between nodes in the selected sets and assesses the statistical significance of this distance by comparing it to distances between randomly generated nodesets with similar degree and connection profiles. This feature is particularly useful for investigating the network relationship between known drug targets and disease-associated genes. Drugs that target nodes close to disease-associated genes may have a higher likelihood of efficacy (10.1038/ncomms10331), making this tool essential for strategic therapeutic development.
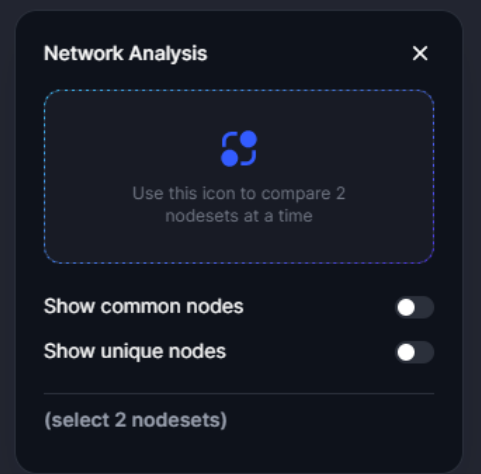
Figure 27. The network analysis tool
Use this icon available at the nodebox level for each nodeset to select the two nodesets for which you want to launch the network analysis.
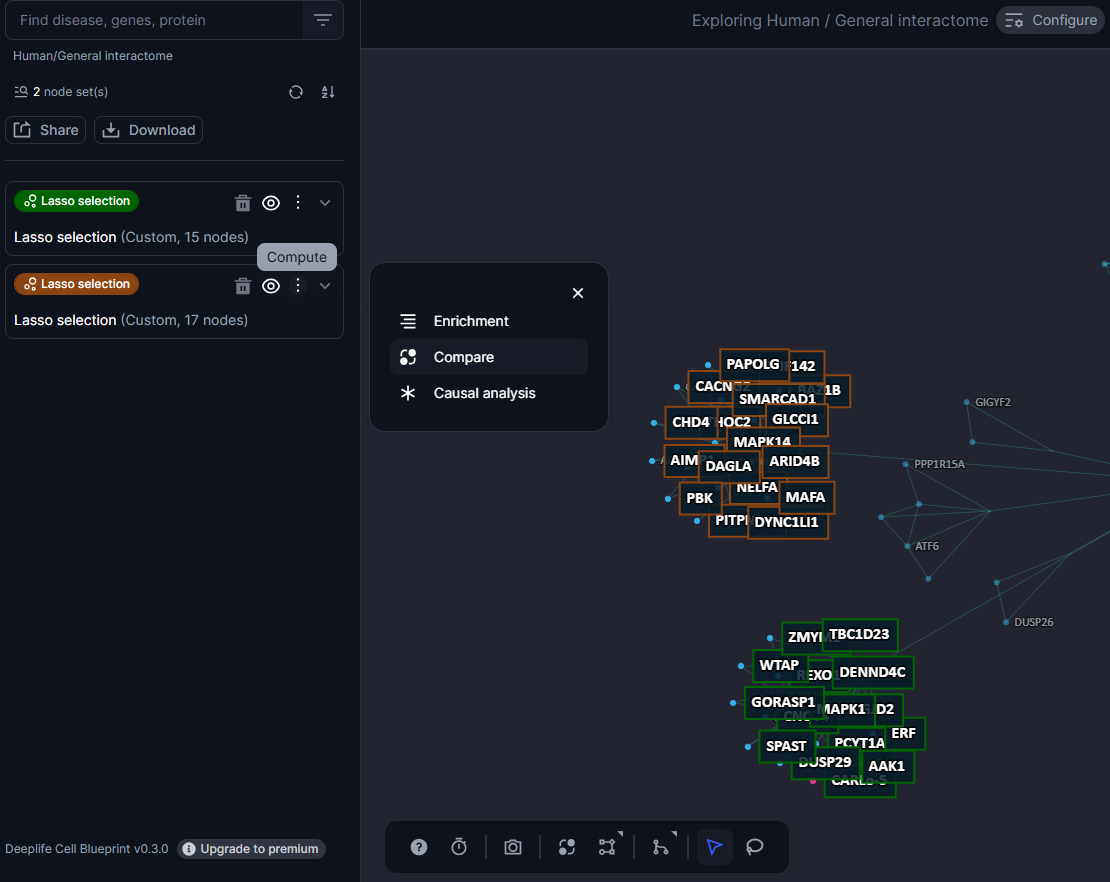
Figure 28. The compare tool is accessible at the nodeset level
Once two nodesets are selected the cell blueprint automatically generates a score giving insights on the proximity of these two nodesets to each other.
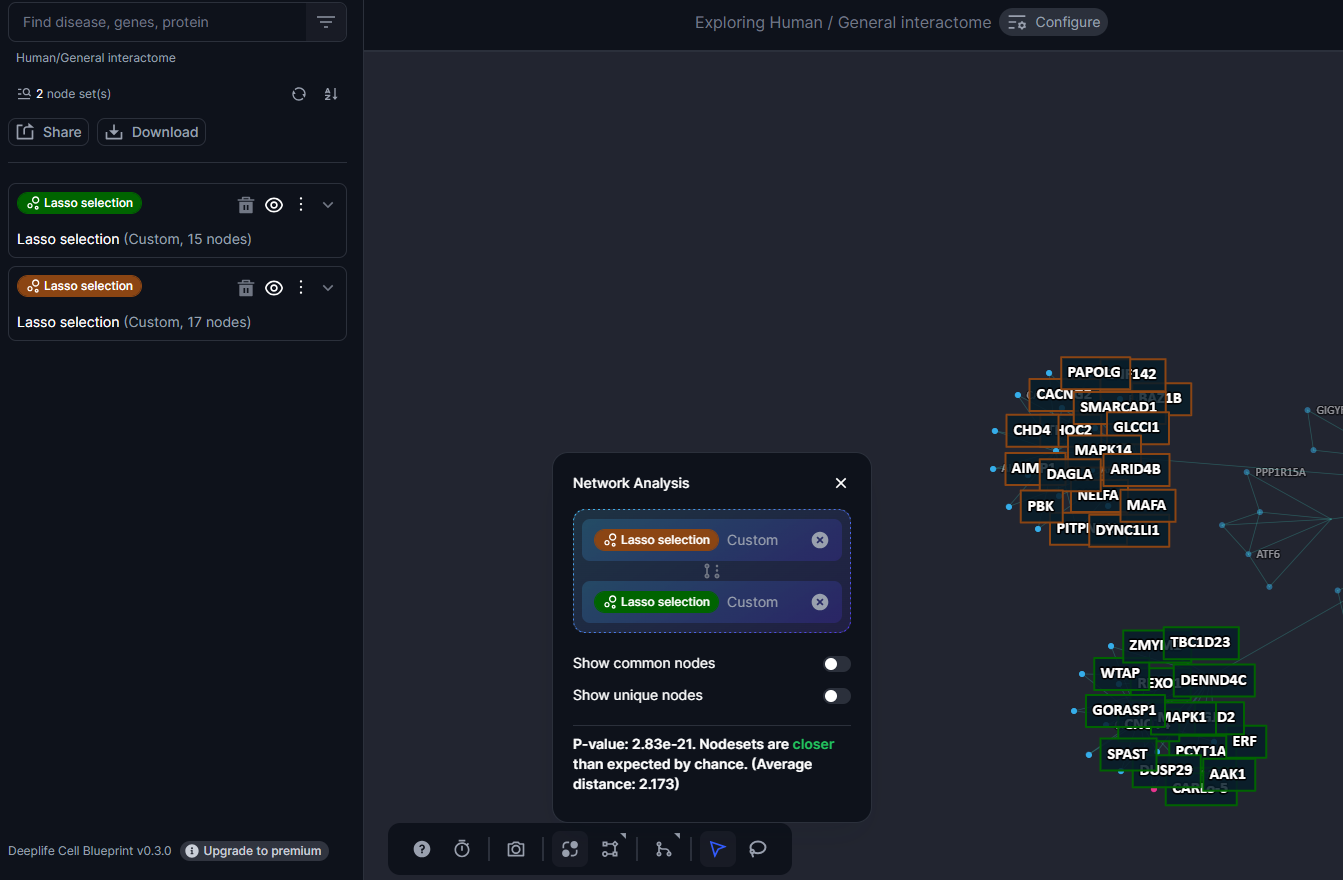
Figure 29. The type of results that is rendered when the network analysis is launched
Deeplife copilot
The Cell Blueprint features a copilot that generates AI-powered summaries of research papers, enabling users to quickly understand the main findings and significance without reading the entire document. This copilot is trained on a meticulously curated database of over 250,000 scientific papers, which is regularly updated with each new platform release. Users can search for specific topics or keywords, and the copilot will retrieve relevant publications. The tool enhances traditional searches by including citation contexts and smart citations in the results. Additionally, it highlights nodes cited in descriptions that are also available in the Cell Blueprint network. Users can inquire about diseases and drugs, and the copilot will provide information grounded in the comprehensive database.
To activate the copilot simply click on this icon and start asking questions in natural language:

Figure 30. The copilot icon
The copilot will take your questions and provide responses grounded in scientific publications.
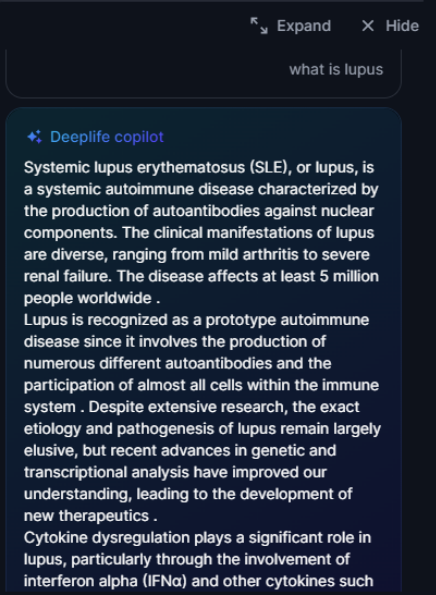
Figure 31. Example of copilot generated answer
NB: The copilot can also be activated by clicking on the "Ask Copilot" button in the description section for each node. This action automatically launches the copilot with a prefilled prompt to generate a synthesized description of the node of interest.

Figure 32. Ask Copilot button automatically launches the copilot
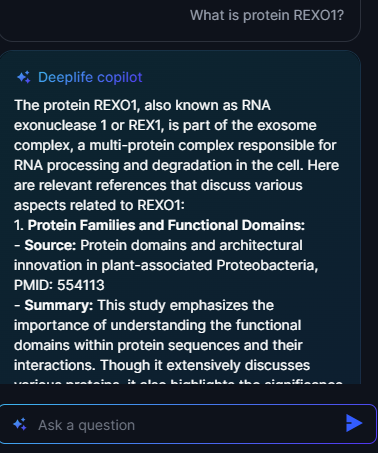
Figure 33. Copilot answer after Ask Copilot button activation