Navigating the Interface
The Cell Blueprint's user-friendly Graphical User Interface (GUI) offers intuitive navigation and exploration capabilities. Upon loading the Cell Blueprint, users will be presented with the full interactome layout consisting of nodes linked by edges.

Figure 5. The Cell Blueprint Interface.
Pan/Zoom
Users can freely zoom in and out and pan across the interactome, simply by scrolling up/down, using the dedicated zoom (+/-) buttons, and clicking and dragging on the interface. A framed minimap can be toggled on/off in the bottom right corner and provides a birds-eye view, enabling users to understand where their current view relates to in the context of the whole interactome.

Figure 6. Minimap view of the Cell Blueprint

Figure 7. Zoomed in view of the Cell Blueprint
Node Colours
Nodes are colour-coded to denote specific biological entities, with cyan for proteins/genes, pink representing lncRNAs, and orange denoting miRNAs.

Figure 8. Legend view of the Cell Blueprint
Search and Exploration
Within the Cell Blueprint, users can select their preferred species and cell type of interest to explore. As such, Cell Blueprint is capable of serving multiple cell type specific interactomes for users to analyse, the number of which will evolve with the upcoming updates of the Cell Blueprint.

Figure 9. Network configuration tool
The Cell Blueprint enables users to easily find molecules of interest and their interacting partners. To search for a specific molecule of interest, use the search bar in the top left hand corner. Here, users can enter official gene symbols approved by the HGNC to locate specific nodes within the network.

Figure 10. Search bar with the filtering tool on the right
Example: Search for interacting partners of GAPDH.
In this example, we use the search bar to find interacting partners of the housekeeping gene, GAPDH. The Platform highlights GAPDH on the layout, and labels all of its interacting partners. Note that the lines connecting interacting partners, called edges, are colour-coded green or pink. This provides directionality information. Interacting partners that act upstream of GAPDH are denoted by pink edges, whereas green edges indicate interacting partners downstream of GAPDH. In this way, as well as providing interaction information, the Cell Blueprint also enables users to shed light on effector-affected relationships for interactions of interest.

Figure 11. Interaction partners of GAPDH visible on the Cell Blueprint network
Node Information Panel
When a user searches for a given molecule on the cell blueprint, a nodebox is used as a source of all available information regarding this molecule. The user can show/hide the molecule on the network, delete the molecule for the sidebar and expand the nodebox to display additional information. In expanding the nodebox, the user can access a general overview description of the molecule and a direct visibility on upstream and downstream directly interacting nodes connected to the molecule of interest. Notably, this listing also indicates the type of interaction for interacting nodes, such as post-translational or transcriptional interactions, etc. The concept of nodebox also applies on each downstream or upstream node where, when expanded, the nodebox renders the same level of information as for the queried molecule.

Figure 12. The nodebox view in the Cell BLueprint
Any downstream or upstream node can be found on the network by clicking on “see on network”. This automatically retrieves the upstream and downstream nodes connected to this particular molecule.

Figure 13. The general overview of the node in the Cell Blueprint
Upstream/Downstream Toggle
The Nodebox also contains a set of toggle switches that enable users to switch between visualization of upstream and/or downstream nodes. For example, if users are more interested in understanding the downstream partners of their query node, they can simply toggle off upstream node visualization. Conversely, users can visualize exclusively upstream nodes simply by switching off the “Downstream Nodes” toggle.

Figure 14. Users can toggle on/off upstream/downstream nodes. On the right panel, only downstream nodes are visible.
Node Description
Amongst the additional controls within the Nodebox is a “View full description” button. When clicked, this button will provide a pop-out description of the query node, indicating additional information such as its function, biological pathway involvement, and any known implications in disease.

Figure 15. The node description panel
A similar description pop-out is available for each of the interacting nodes identified. Users can “Ask Copilot” to generate a more detailed description. They can also give their feedback on the description available to allow DeepLife team to take into account any updates from experts. Node descriptions are available for all listed nodes in the node information panel. The descriptions are generated based on publicly available scientific references. These references are embedded within the text in the form of a number with a hyperlink to article page directly accessible when clicking on the number
Nodesets
The cell blueprint allows users to search for nodes, disease, drug, biological process & pathway. Disease, drug, biological process & pathway are represented as a nodeset within the nodebox and many features are rendered active at the nodeset level thus allowing the user to gather biological insights. The various nodesets were obtained from the following sources.
- disease: Disease-associated genes from ClinVar
- drug: Targets of drug from OpenTargets
- biological process: Genes associated with GO biological process
- pathway: Reactome pathway genes

Figure 16. Features active at the nodeset level
Users can select each node within the nodeset that can be explored individually for further analysis.
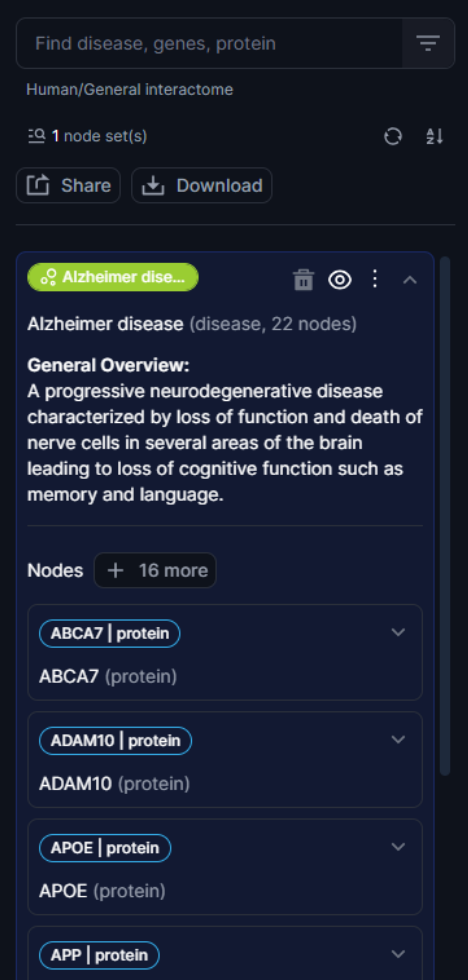
Figure 17. Visibility on nodes in the nodeset
Any node or nodeset can be deleted from the search history by simply clicking on the bin icon. The full history of search can be either cleared or ordered alphabetically.

Figure 18. Features to delete or order the search history
Multi-node searches
The Cell blueprint enables users to perform multi-node searches to jointly explore a list of nodes of interest simultaneously. Simply copy and paste your list of nodes separated by comma. Cell Blueprint will automatically generate a nodebox containing your nodeset of interest.

Figure 19. Multi-node search view using the search bar
The Cell Blueprint will also display the labels of the query nodes, enabling users to understand their positioning on the layout, as well as perform enrichment analysis (see below).
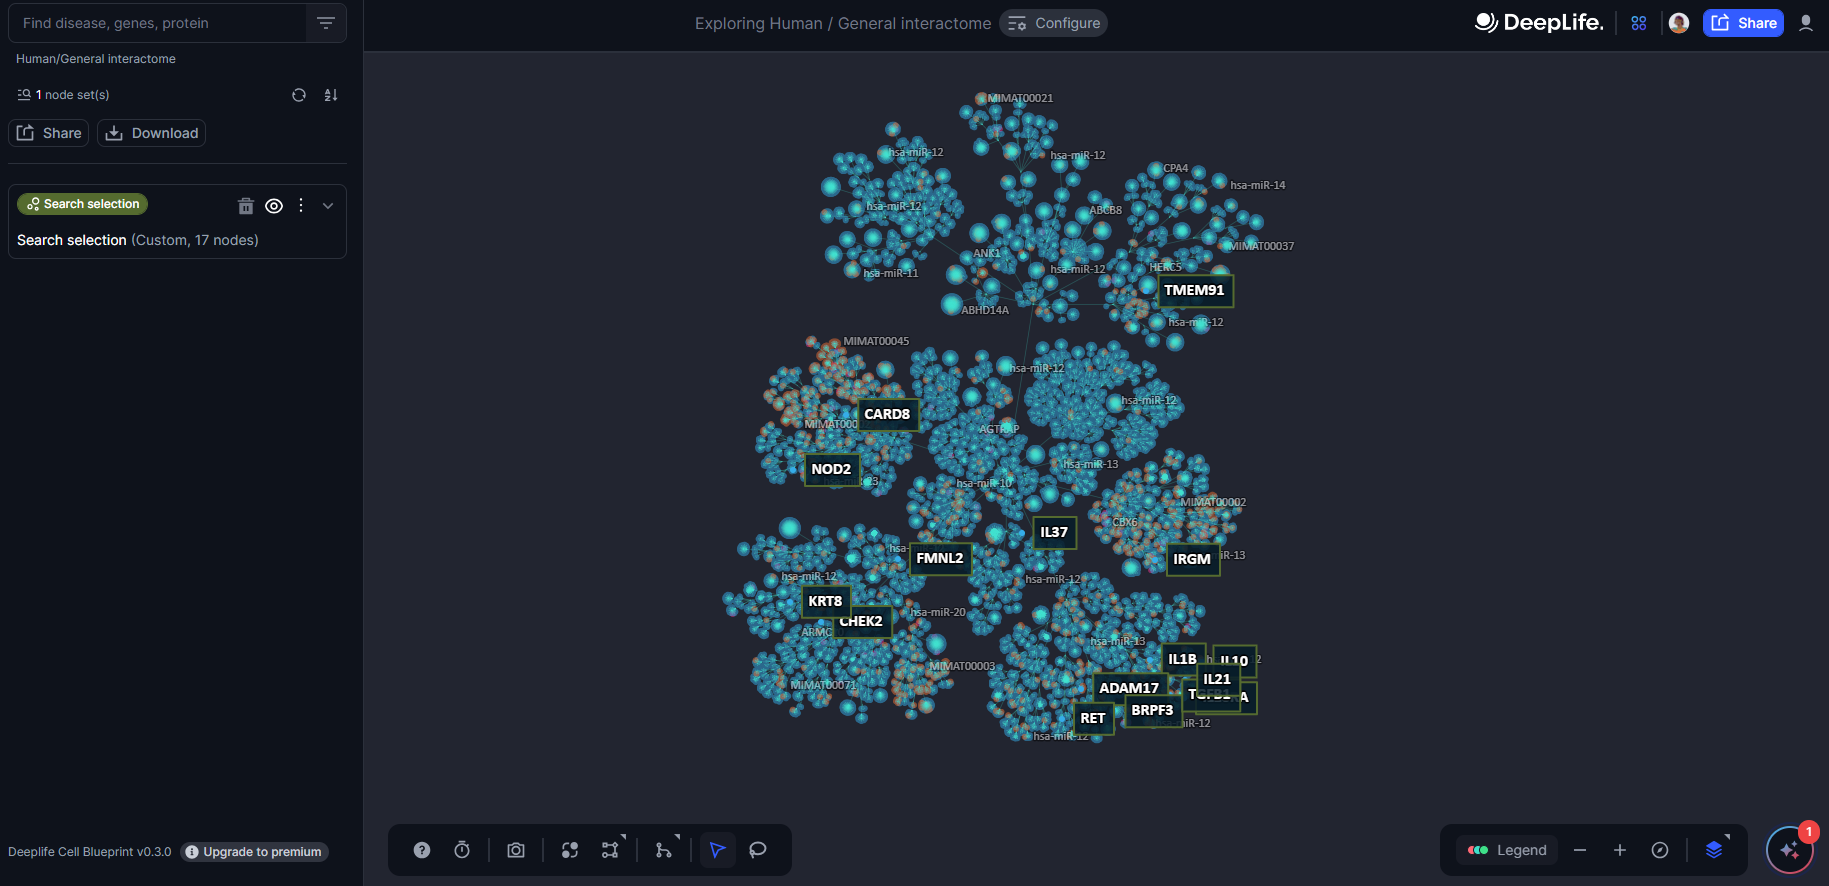
Figure 20. A multi-node query for IL1B, NOD2, ADAM17, BRPF3, CARD8, CHEK2, IL10, IL10RA, IRGM, RET, TGFB1, TMEM91, KRT8, IRGM, IL37, IL21, FMNL2
The Toolbox
The Cell Blueprint is equipped with a toolbox that provides access to various additional features. From the toolbox, users can access a help centre, where the user manual is available, as well as a button to directly contact the DeepLife support team. The user can also access a feedback form to share their experiences using the cell blueprint. The toolbox also contains a “Flight” button. When clicked, this will change the standard Blueprint layout into “Flight Mode”. Flight mode, reminiscent of more classical network visualisation approaches, directly shows all interactions for the query node, without clustering edges via conduits.

Figure 21. The toolbox view
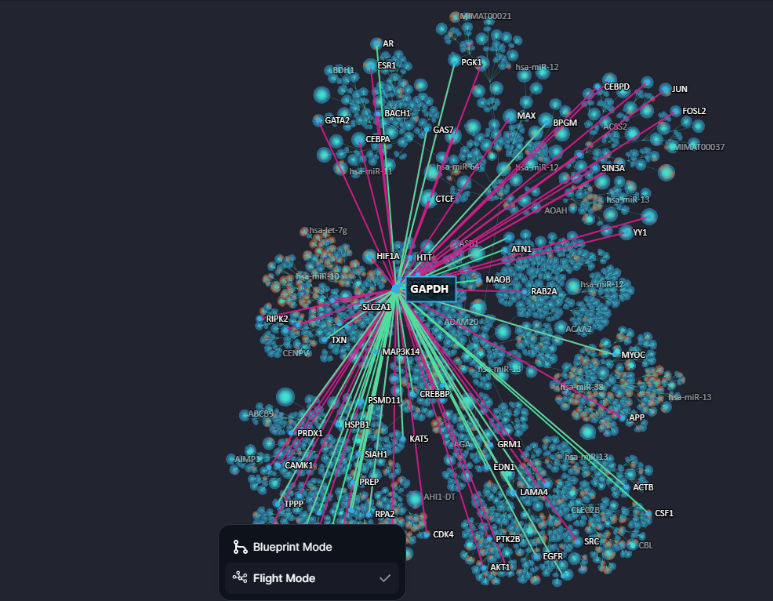
Figure 22. Cell Blueprint in Flight Mode, querying the gene GAPDH.
Generating a nodeset with lasso tool.
The toolbox contains a lasso tool that allows the user to select a region on the network and automatically generate a nodeset based on this region.
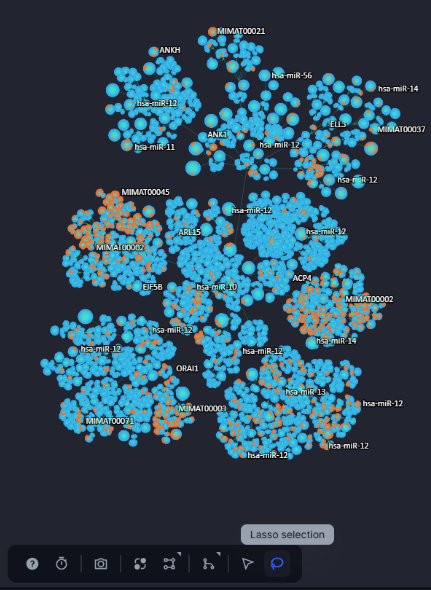
Figure 23. The lasso selection tool
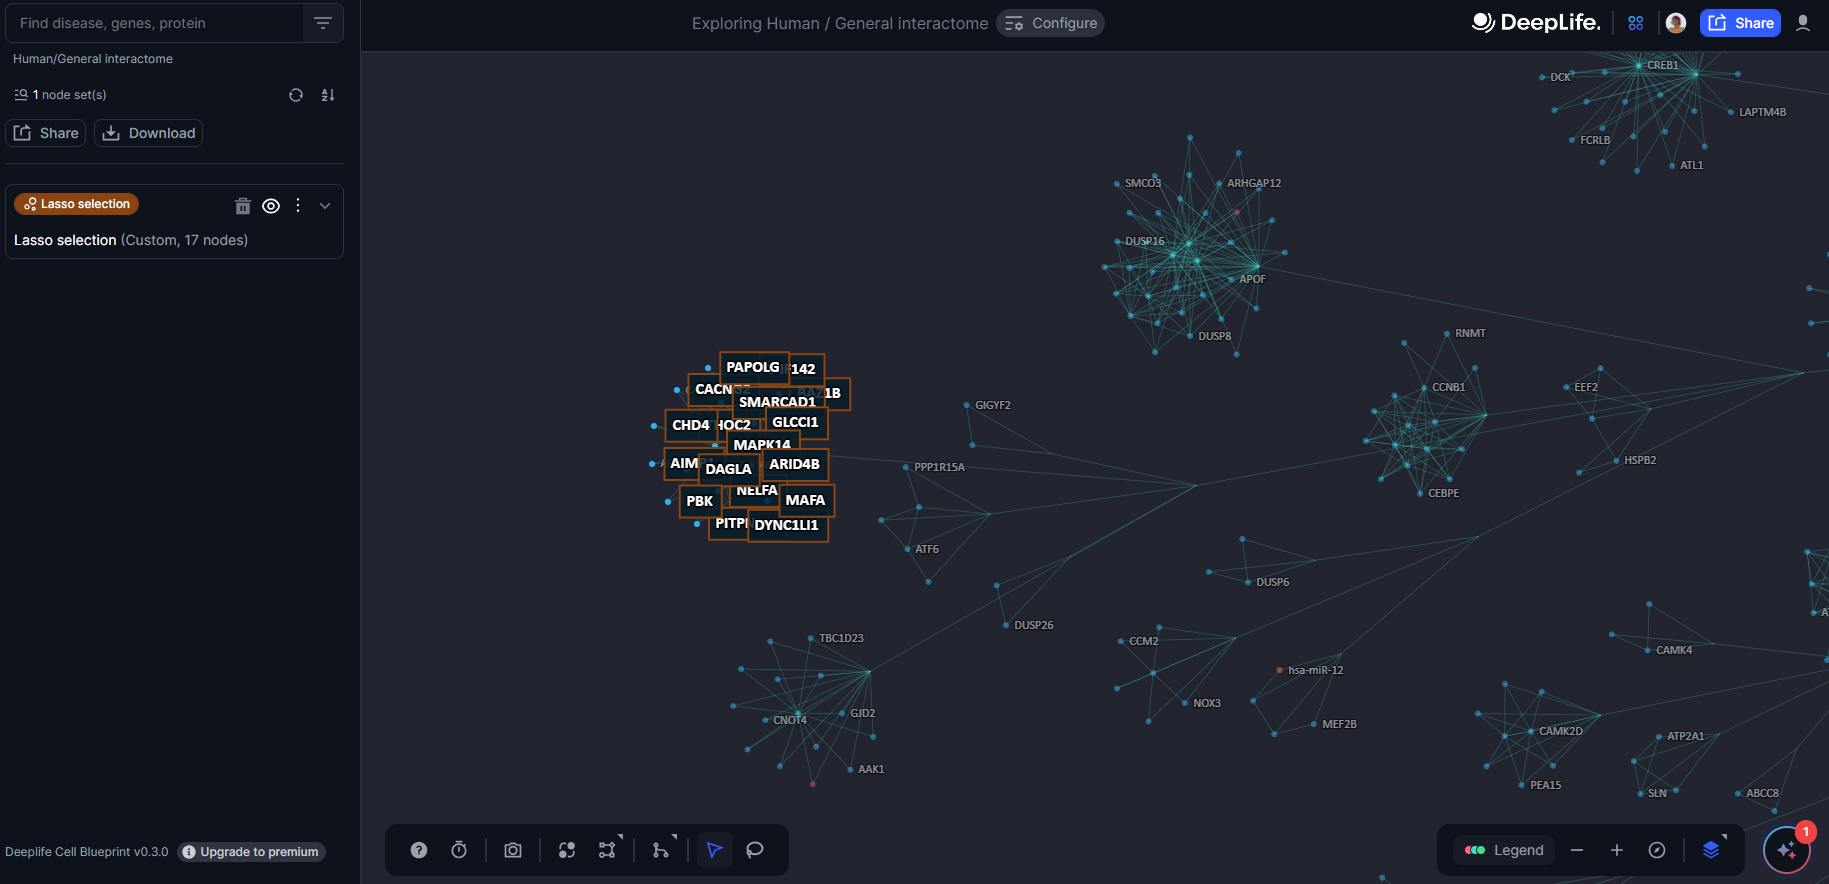
Figure 24. The nodebox created after lasso selection